Critical Lines and Multicritical Points
A three-part tutorial series: how a system can be critical at one point, along a whole line, or only nearly — and how an instrument that follows the renormalisation-group flow tells these apart.
0 Follow the flow: four verdicts ◆ design
Watch how fast the renormalisation-group flow moves as you change scale: it stops at one place, stops wherever it lands, slows and then leaves, or the data cannot tell.
The series is written for someone building the Criticality Compass: a DetectorThe component that reads observations of a system and returns one verdict about its critical geometry: POINT, LINE, WALKING or REFUSE. that classifies a system's critical geometry from its observations, and a NavigatorThe component that finds a critical line and moves along it, keeping the system critical while its control parameters change. that finds a critical line and moves along it. All three pages share one vocabulary:
- POINTAn isolated fixed point: the flow stops at one place and has one way out. The 2D Ising critical point is the reference.2
- LINEA continuum of fixed points, with an exactly marginalA direction in coupling space along which the flow neither grows nor shrinks: moving along it changes the fixed point, not the distance from criticality. direction: the flow stops wherever it lands. The low-temperature phase of the 2D XY model1 and the self-dual line of the Ashkin–Teller model,2 whose exponents vary continuously along it.
- WALKINGThe flow slows to a small nonzero minimum, never stops, then leaves. The 2D Potts model with q = 5 is first order, but its correlation length is about 2500 lattice spacings, so every smaller system looks critical.3
- REFUSEThe honest verdict when the data cannot tell — a value the instrument returns, not an error. It is the default cell.
For the Compass
What the Detector measures is how the flow moves as the scale and the control parameters change: how fast it goes, how much it builds up, and whether it circulates. Each page ends every section with a box like this one, saying what that section means for the Detector or the Navigator.
Working equations
For a POINT, the flow near the fixed point is linear, with one relevant eigenvalue: tune the control exactly and the flow speed goes to zero; tune it slightly off and the flow leaves. For a LINE, one eigenvalue is exactly marginal (y = 0), so the flow stops on the line from a whole region of starting points. In the 2D XY model this is the Kosterlitz flow dy/dt = −xy, dx/dt = −y², which stops on the line y = 0, x > 0, and whose invariant y² − x² sorts the trajectories.1 For WALKING, the fixed points have moved off the real axis, and the flow passes close to them without stopping.3 The pages derive each of these in full.
Full derivation
The derivations live on the tutorial pages themselves: the Kosterlitz flow on the Kosterlitz–Thouless page, the Ashkin–Teller line and the walking Potts transition on the models page, and the linearised flow matrix with its eigenvalues on the techniques page.
The three pages
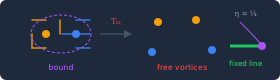
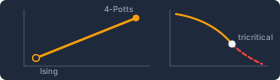
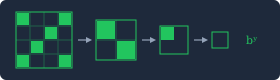
Every page works the same way: each section shows a headline, one graphic and a takeaway with everything folded; the working equations and the full derivations are folded underneath; every section ends with a short quiz, and every page with a retakeable final test.
Scoreboard
Your results on the three pages, kept in this browser. Export copies a short plain-text summary you can paste into a conversation.
The combined test
Thirty items drawn from all three pages at once — names, concepts and equations (the interactive tasks stay on their pages). Each attempt draws a different set, and the best and latest scores are kept.
The name roll
The people, models, methods and results of the whole series, one at a time. A name you miss comes back in the export's “names missed” list.
How your scores are kept
Scores live in this browser only: in localStorage, with a small cookie copy
(best and latest scores and which sections are mastered, under 4 KB) that can restore the
summary if the main copy is cleared. Nothing is sent anywhere. If your browser blocks site data, the
quizzes and tests still grade, and every panel says that the scores are not being saved.
Reset all scores in the scoreboard erases both copies.
- Hasenbusch, M., Marcu, M. & Pinn, K. (1994). High precision renormalization group study of the roughening transition. Physica A 208:124. doi:10.1016/0378-4371(94)90536-3 (arXiv:hep-lat/9404016) — the Kosterlitz flow and its invariant, eqs 22–24. ↑
- Wiseman, S. & Domany, E. (1993). Cluster method for the Ashkin–Teller model. Phys. Rev. E 48:4080. doi:10.1103/PhysRevE.48.4080 — the self-dual critical line from the Ising point to the four-state Potts point, with continuously varying exponents. ↑
- Gorbenko, V., Rychkov, S. & Zan, B. (2018). Walking, weak first-order transitions, and complex CFTs. JHEP 2018(10):108. doi:10.1007/JHEP10(2018)108 (arXiv:1807.11512) — the q > 4 Potts transition is weakly first order; the correlation length at q = 5 is 2512.2 lattice spacings. ↑